Power BI Hospital Data Analysis Project
Project Overview:
I worked on a Power BI project that involved analyzing a hospital dataset spanning four years. The dataset consisted of two types: Inpatient and Outpatient, with each type containing four Excel sheets corresponding to each year. The total data volume comprised 453,119 rows across all sheets.
Key Tasks and Methodologies:
1. Data Integration and Transformation:
- Loaded multiple Excel records into a single Power BI project.
- Ensured data consistency by verifying column values and data types.
- Standardized column names across all tables to maintain uniformity.
- Added a new column to the Outpatient dataset to align with the Inpatient dataset, ensuring both had corresponding columns in the same positions.
2. Data Append and Merging:
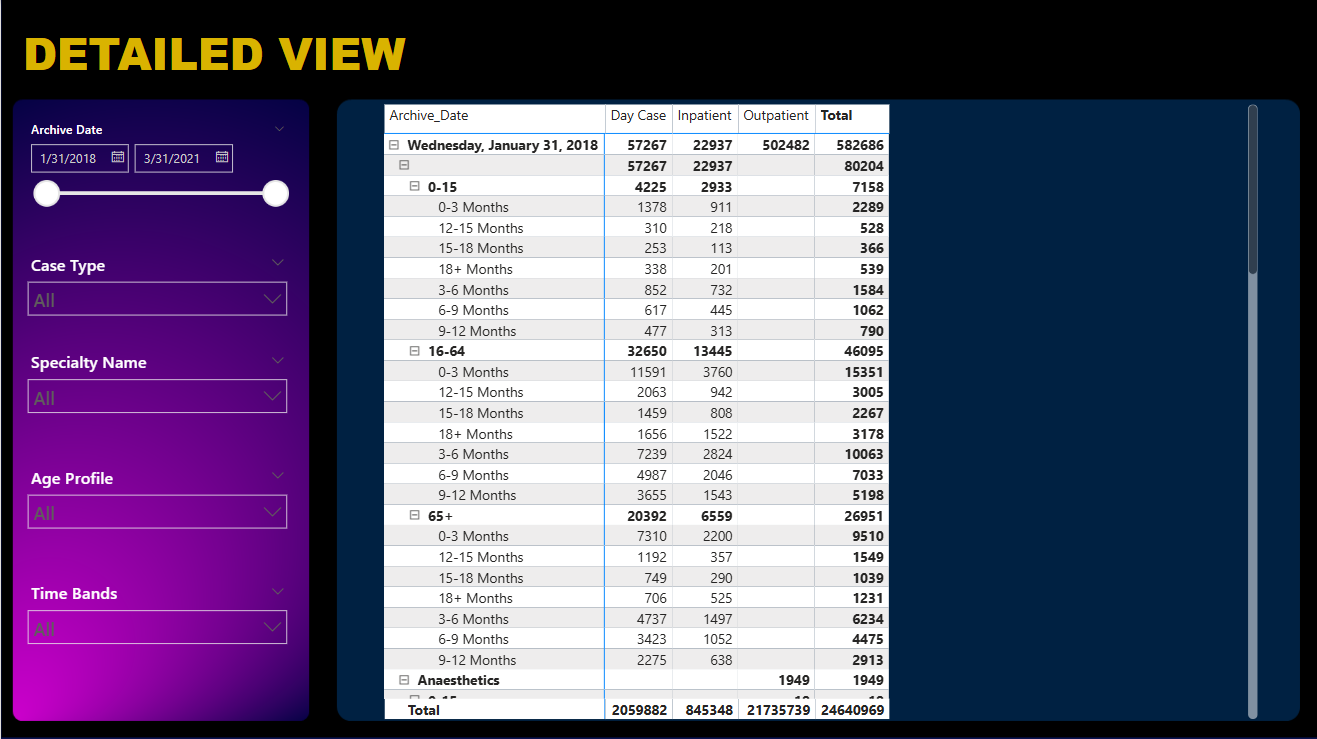
- Used "Append Queries" and "Append Queries as New" to combine the Inpatient and Outpatient datasets into a new consolidated table named "All_Data."
- Categorized 78 different specialty names into broader groups to enhance data analysis.
- Transformed data by using the first row as column headers.
- Created relationships between the categorized specialty buckets and the appended dataset (All_Data).
3. Data Analysis and DAX Expressions:
- Implemented DAX (Data Analysis Expressions) to create key measures:
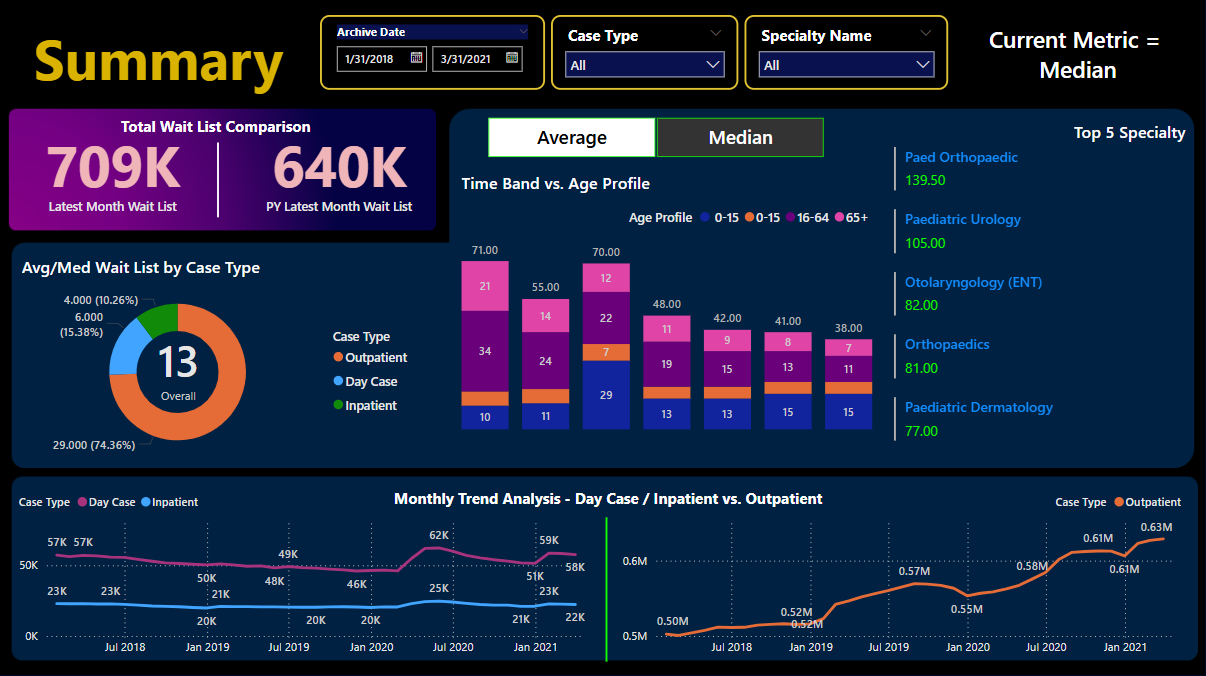
- Latest Month Wait List: Summed the total waitlist column while filtering for the maximum date in the dataset.
- PY Latest Month Wait List: Retrieved the waitlist count for the same month in the previous year.
- Dynamic Measure Mechanism: Created a blank table to toggle between Average and Median metrics.
- Developed separate measures for "Average Wait List" and "Median Wait List," with an additional measure enabling dynamic switching between them.
4. Data Cleaning and Optimization:
- Identified and resolved issues with repeated data entries in stacked column charts by correcting column values in Power Query Editor.
- Trimmed data, removed blank values, and filtered out empty fields to enhance data quality.
- Replaced inconsistent values (tautology) to standardize data entries.
5. Data Visualization and Interactive Features:
- Designed a structured data visualization blueprint to guide dashboard development.
- Integrated slicers for filtering data by date, case type, and specialty, allowing flexible data analysis.
- Adjusted element interactions to improve visualization responsiveness.
- Implemented measures to ensure charts display "No Data Available" when filters or slicers yield empty results.
Outcome:
This project successfully transformed a complex hospital dataset into a structured and interactive Power BI dashboard. By applying robust data transformation techniques, DAX measures, and interactive visualizations, I was able to deliver insightful analytics that improved data accessibility and usability for decision-making. The project demonstrated my proficiency in Power BI, data wrangling, DAX expressions, and interactive dashboard design.